Introduction to the Intel Management Engine OS (Part 2)
If we wanted to analyze a ME module, we might start by taking its base address from the decoded metadata file, as per (Goryachy, Ermolov, & Sklyarov, 2017). That would look something like this:
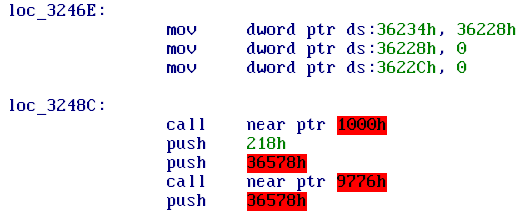
To better understand this disassembly, we need to look at the memory map for a userland ME module. Figuring out the specifics took significant amounts of my time earlier this year, as the kernel is even tougher to understand than the modules themselves. It was already known that 0x1000-0x2000 contained the entry points for the ROM library and that 0x9000-0xa000 was the system library dispatch table (Goryachy, Ermolov, & Sklyarov, 2017).
The way these ranges work is simple: the ME uses shared libraries, but has no real dynamic linker. Instead, symbols are resolved at compile time by having a range of fixed-address vectors at the start of the libraries. This allows the size of library code to vary without having to recompile the modules using the library. The lack of import and export tables means that we have no symbol names to depend on for understanding the library calls.
In order to make sense of them we need to look at the library implementation, which for syslib is possible as it is contained in the flash ROM. However, the ROM library at 0x1000 is contained in on-die memory which we can only read once we already have code execution on the ME core. This was initially a significant problem for me; I had to resort to guessing functions by their usage, and the ROM library contains most of the OS-independent C library code so ignoring calls is not feasible. There is, however, a way around this dependency loop: for internal testing, Intel allows pre-production firmware to override the on-die ROM. Some of those firmware images have leaked, containing a partition called ROMB (ROM bypass) which provides a way to look at ROM code without having to first break ME security (Skochinsky, 2014)(Goryachy, Ermolov, & Sklyarov, 2017).
This leaves the read-write memory areas, which are located above the image text. We would expect a UNIX program to have .text, .data and .bss segments, but the image we have seems to be a flat binary, with metadata that does not directly reference the section addresses. We can guess there is some read-write memory by looking at the accesses, but to better understand what is going on we will need to pick apart the module entry point code.
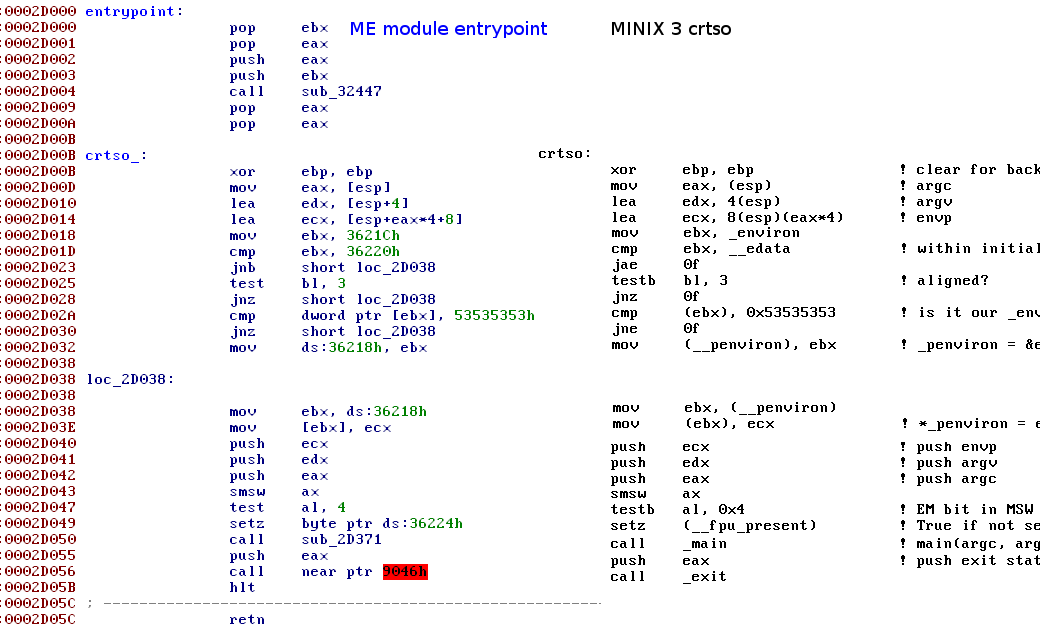 Comparison of ME module with minix3 code at https://github.com/jncraton/minix3/blob/master/lib/i386/rts/crtso.s
We can see that the crtso (C RunTime StartOff) is mostly taken from minix, but that before any of the normal startup code runs, another function is called. This function is critical because it not just runs all the syslib initialization code (.init in linux) but also sets up the initialized data section.
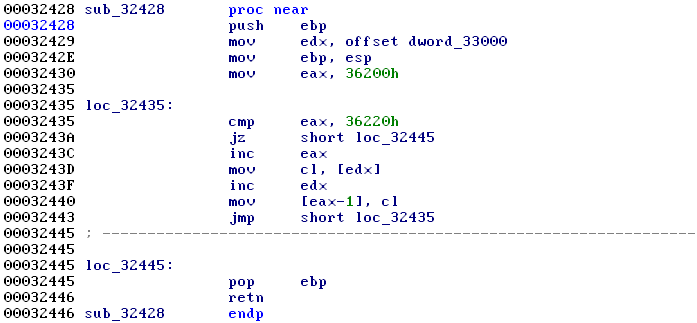
This is the solution to using a mostly flat image format for code targetting a POSIX environment: have the kernel prepare a large .bss area and copy a small portion of the read-only data section to it. This data section is always at the start of the bss area and can thus be used to infer the .bss base address.
We now have a sufficiently good understanding of the memory map to start picking apart a module. When doing so we will run into the second surprise: one of the first steps we often take when analysing code is to look at the string literals present in it, and most of these modules contain only a handful of them.
A few do contain numerous strings, such as old revisions of evtdisp and busdrv, but most use Intel SVEN for debugging. SVEN is a technology that moves the format strings from the software under test to the debugger. It replaces printf() calls with sven_trace_<par_count>() calls that use a numeric ID to refer to a format string in a dictionary. Trimmed down versions of such dictionaries have leaked as part of some Intel System Studio releases, but no full versions are known to exist.
If we want to start attacking vulnerabilities in modules, we also need to know the location of the stack. This cannot trivially be deduced from the modules, so we either need to guess it from known memory sections, or painstakingly reverse engineer the microkernel.
 The rough memory layout for a normal ME process - the orange areas are read only, the green area is read-write and no areas above
 .text are executable.
To better understand how this layout is derived from the metadata file, look at user/loader/map.c in the meloader source, which is part of an emulator I wrote to be able to do dynamic analysis of ME modules.
Due to the microkernel design used for the ME operating system, device drivers are also user-mode processes. This means there has to be a mechanism to provide access to memory-mapped IO (MMIO) address ranges from user space.
The ME mostly depends on x86 segmenting for its memory protection model, allowing very fine grained access control to memory ranges. I will cover the specifics of this memory protection model in a future article about the ME kernel, but will cover the relevant bits for understanding MMIO in driver modules here.
The module metadata contains a list of MMIO ranges, which are exposed as the first few segments in the LDT. To construct a segment selector (segment register value) we can refer to the Intel Architecture Manual, which yields sel = (mmio_index << 3) | 7.
The selectors are usually not directly accessed by user code, but only by the ROM library. In order to be able to emulate ME code, I had to hook these.
Their addresses for Sunrise Point-LP chipsets are listed in cfg/spt_lp.cfg in the meloader source.
Another important segment used by the ME is the thread-local segment (TLS), which is pointed to by [gs:0]. It is located at the top of the stack and contains pointers to the C library context as well as the errno value and thread ID (Goryachy & Ermolov, 2017).
 The TLS structure.
The next article in this series will describe how to use a buffer overflow vulnerability in the bup module to gain almost unlimited access to the ME system.
References
- Goryachy, M., Ermolov, M., & Sklyarov, D. (2017). Intel ME: The Way of the Static Analysis. Troopers. Retrieved from https://www.troopers.de/downloads/troopers17/TR17_ME11_Static.pdf
- Skochinsky, I. (2014). Intel ME secrets. CODE BLUE. Retrieved from https://www.slideshare.net/codeblue_jp/igor-skochinsky-enpub
- Goryachy, M., & Ermolov, M. (2017). How to Hack a Turned-Off Computer, or Running Unsigned Code inIntel Management Engine. Black Hat Europe. Retrieved from https://www.blackhat.com/docs/eu-17/materials/eu-17-Goryachy-How-To-Hack-A-Turned-Off-Computer-Or-Running-Unsigned-Code-In-Intel-Management-Engine.pdf